
During my 1-year full-time tenure and 3-month internship at Ant Group, Alibaba, I owned the design of AntInsights — a SaaS no-code, data analytics & collaboration platform tailored for 20,000+ internal employees across various roles. The product goal is to help users efficiently explore data, uncover insights, and make informed, data-driven decisions.
I led the user research and design efforts to reduce the learning curve and enhance the accessibility associated with data analysis, visualization, and collaboration for our extensive user base.
My Roles -
For -
Ant Group, Alibaba - Ant Design Team
AntV: An Open-Sourced Enterprise Data Viz Solution
Timeline -
Full-time (Jul. 2021 - Jul. 2022)
Internship (Jun. - Sep. 2020)
Tools -
Sketch / Figma
Photoshop
Tableau
Protopie
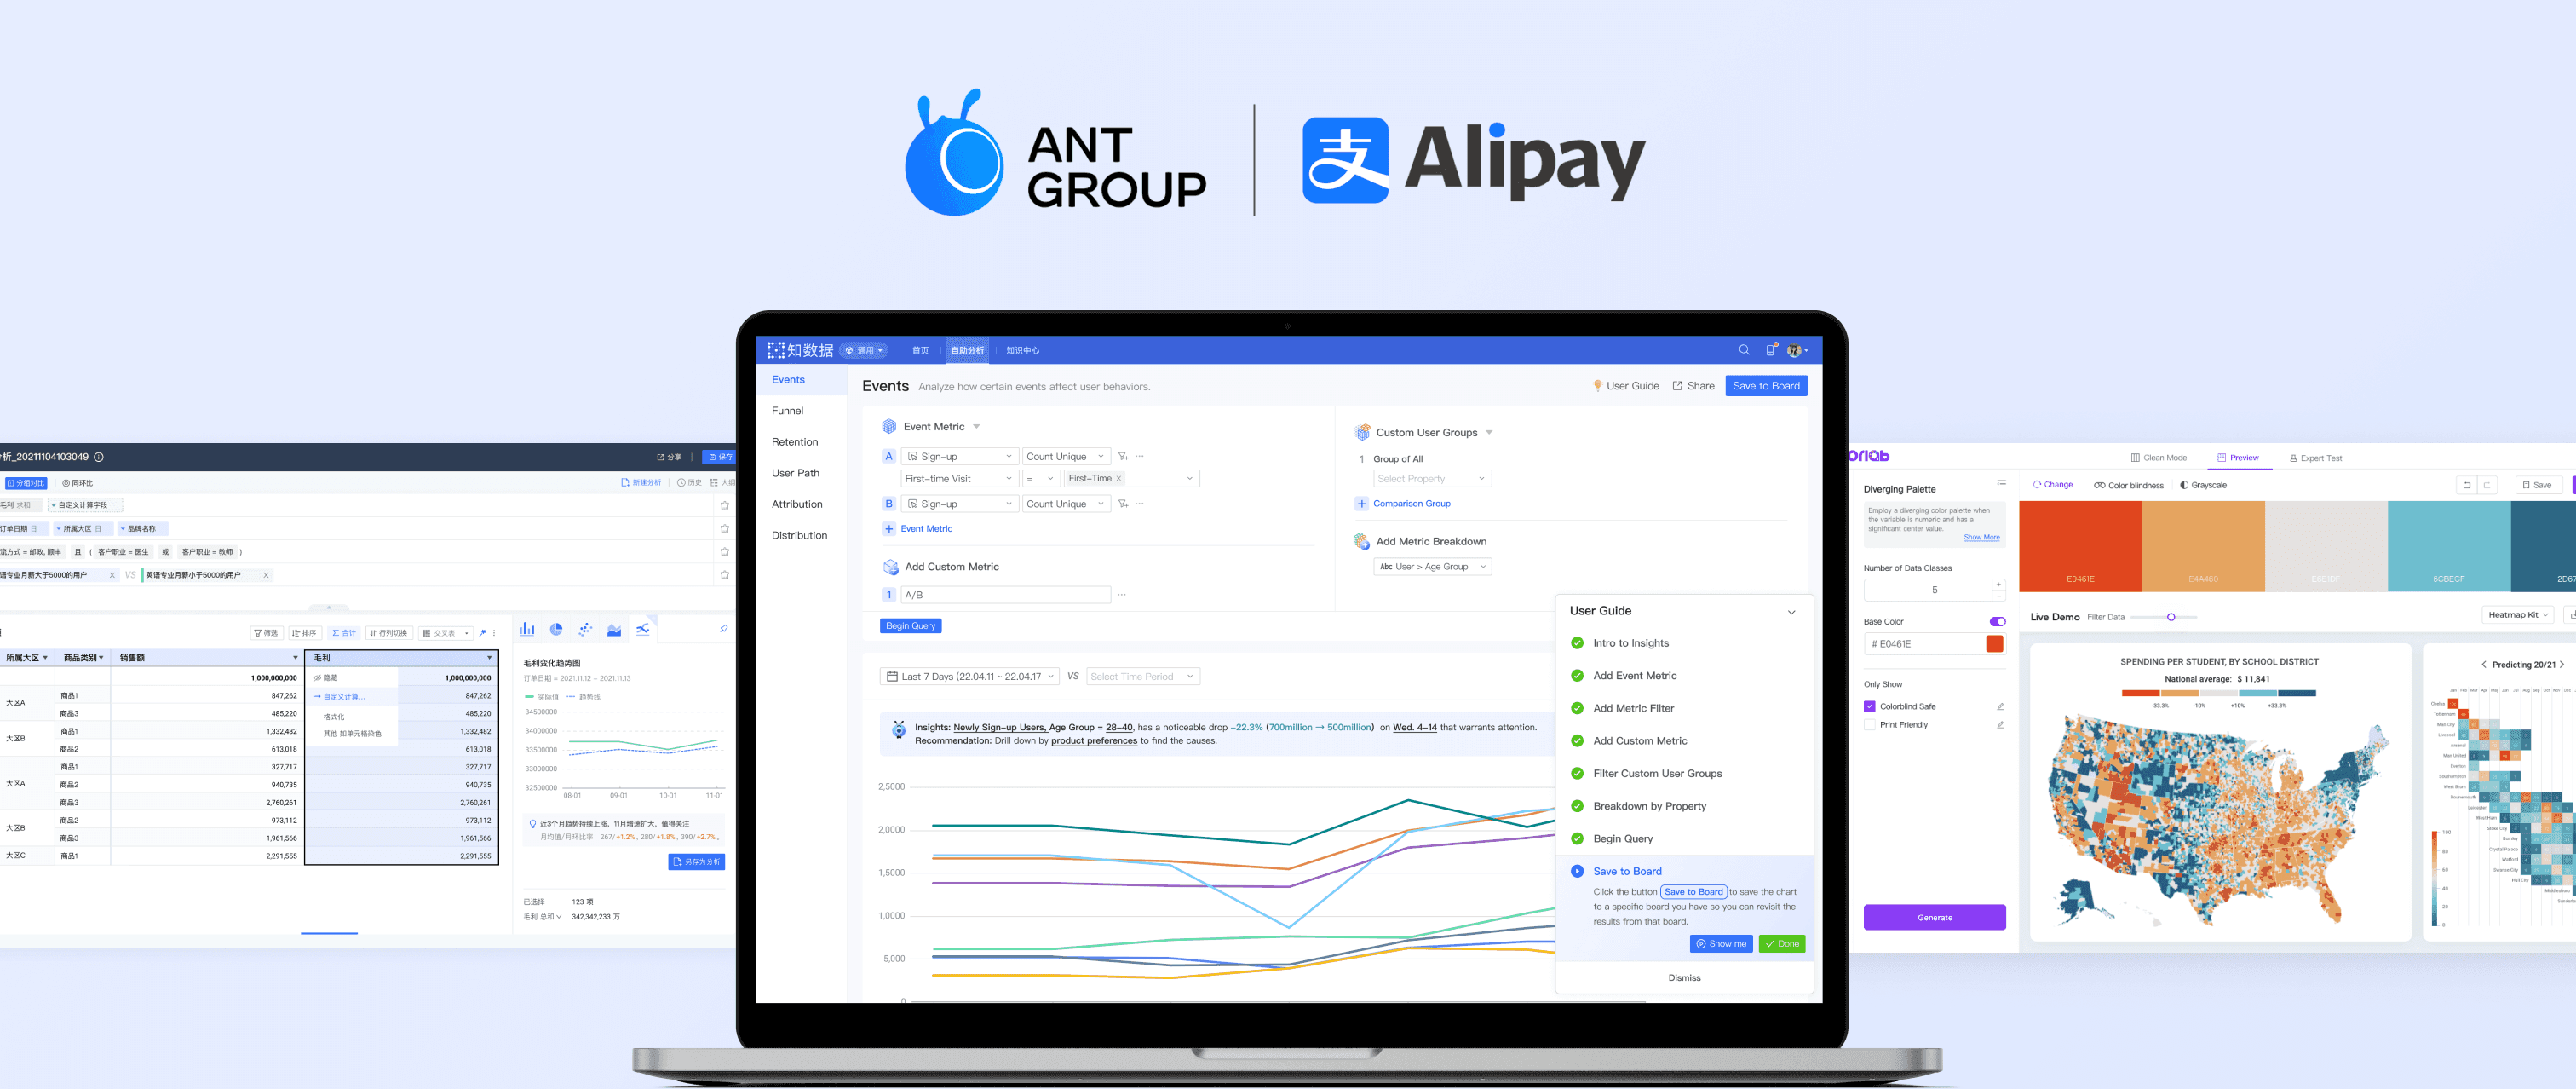
👩🦯 Making self-analytics easy to learn and adopt from first-time use
I led the redesign process of SaaS self-analytics tools to lower the learning curve for non-technical, new users and improve user adoption, including creating a smooth onboarding process and enhancing the accessibility of visual analytics.
🎉 Impact: Elevated Task Success Rate from 52% to 100% during usability tests and drove successful user adoption increase from 5,000+ to 9,000+ within 2 quarters after launch.
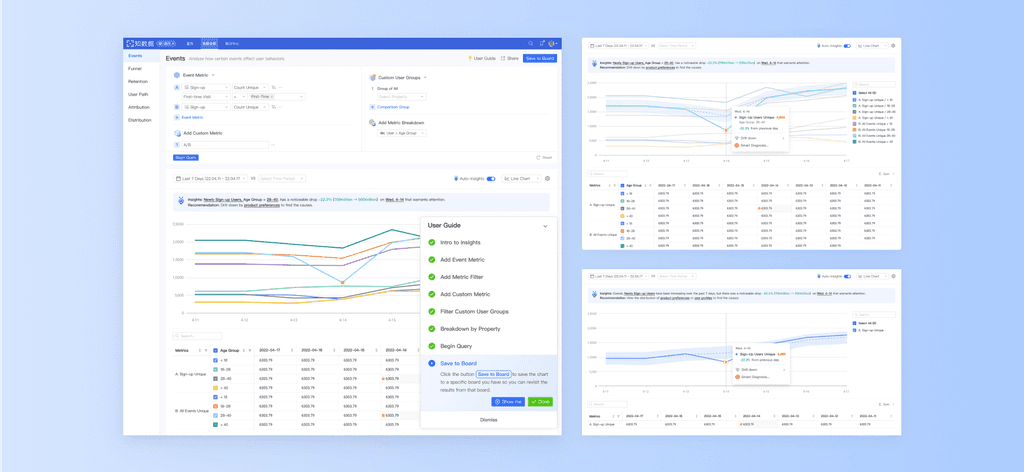
SaaS / Enterprise Data Analytics Platform
Case Study
📝 A no-code data-storytelling editor to easily create and share textual data reports
Natural language is a straightforward and accessible way to convey key insights in data reports. Previously, users need to manually edit such textual content, which is error-prone and cannot keep data updated in real-time.
Therefore, I led the research and design of a novel, no-code editor within the Ant Group SaaS report builder for users to efficiently incorporate essential data-driven information into their data reports. I closely collaborated with engineers to implement the novel design of "data content blocks" in the editor, which enables efficient textual data report template reuse and real-time data updates.
🎉 Impact: Launched within the SaaS report builder and received very positive user feedback for the more intuitive and lightweight design. Released as open source by AntV, China's premier data viz library.
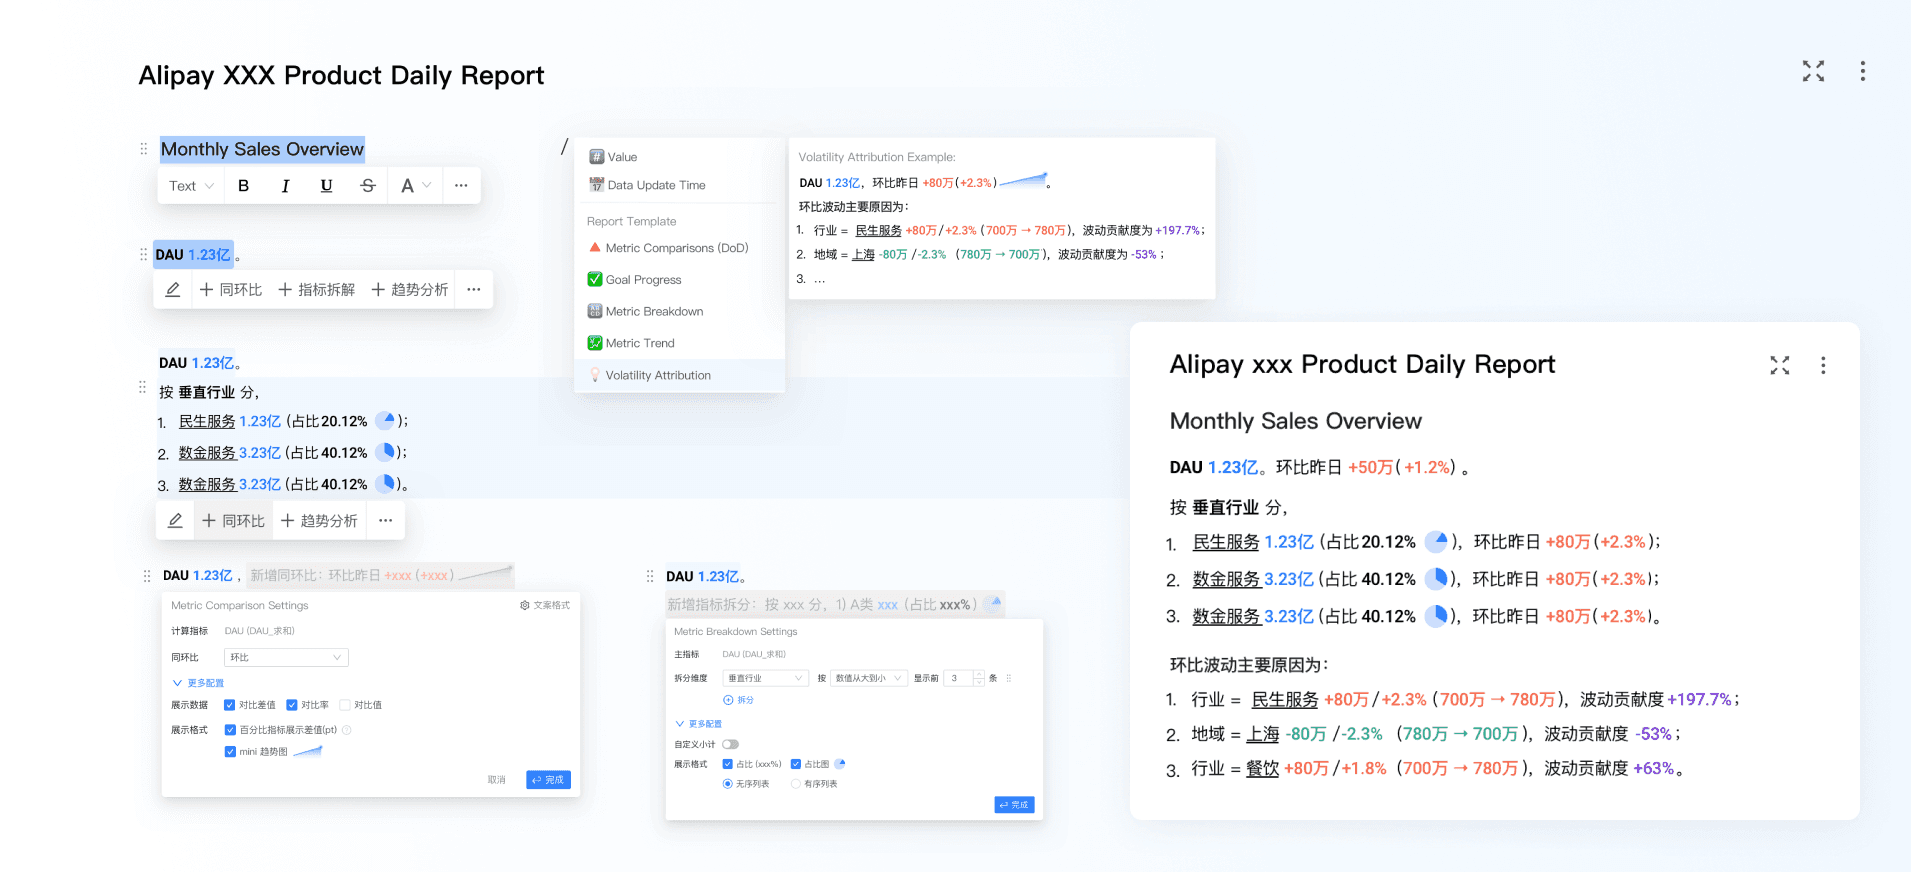
SaaS / Enterprise Data Collaboration Solution / No-code Report Editor
Contact Me
💡An open-source solution for intelligent & flexible tabular data analysis
Cross table is an effective tool for exploratory data analysis. I contributed to the design of a new version of the cross table to support flexible multi-dimensional cross analysis. Besides, to facilitate tabular data exploration, I designed a novel peripheral panel that can visualize user-selected cells intelligently and provide immediate key insights and closely collaborated with engineers to design the rules for automatic visualization recommendations.
🎉 Impact: Received positive user feedback for significantly improving efficiency in tabular data analysis after launch.

🎨Creating satisfying, accessible data-viz palettes in a smooth, smart, and efficient way
I conceptualized and designed a data visualization palette generator, which streamlined the entire design process for visualization palettes, enabling efficient creation, assessment, and optimization of accessible palettes tailored for data visualizations.
🎉 Impact: Launched the product and received warm user feedback from designers, developers, Business Intelligence, etc, for improved palette creation quality and efficiency.

🫶 Workshops that help internal workers learn data visualizations in a fun way
Besides UX/UI design, I also contributed to the organization of workshops that help internal workers, especially those with low data literacy, to learn data visualizations through a series of lectures and engaging hands-on activities.
